A data-dictated look at whether Denver’s free August public transit policy had its intended effect on air quality.
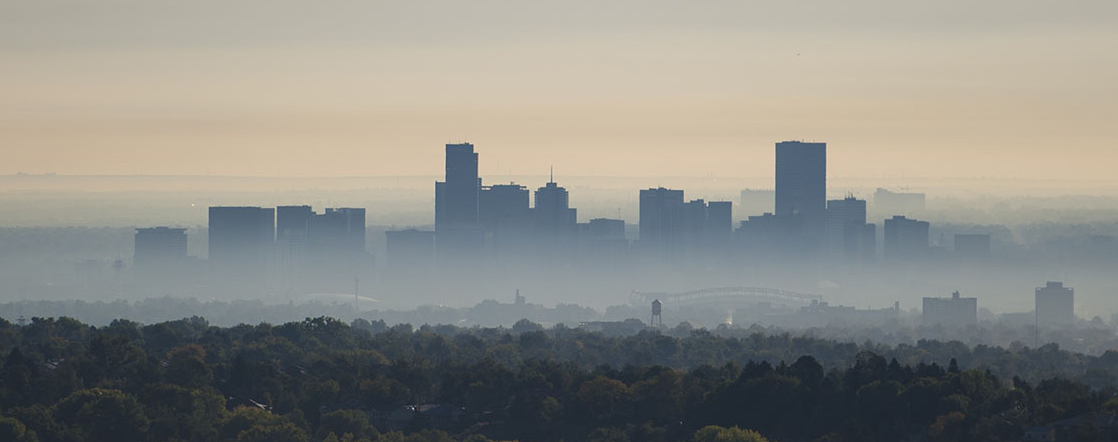 Image credit: National Renewable Energy Laboratory, Colorado State University
Backstory
Most summers, Coloradoans flock to the majestic Rocky Mountains with their beautiful hikes and various mountain activities. This is the case, at least, unless poor air quality forces them indoors. For me, this occurred on a smoky July day in 2020, when surreal “snowing” ash sprinkling down from nearby wildfires forced us to evacuate the pickleball courts.
Between wildfires and pollution, Denver’s summer air often leaves room for improvement. Sadly, the Rockies don’t seem so enticing when they are obscured behind a polluted haze.
In August 2022, I noticed my RTD bus was more crowded than usual, and I was not asked to scan my bus pass. This is how I learned of Denver’s 2022 “Zero fare for cleaner air” initiative. Throughout the month, my packed bus led me to believe the policy did work to increase ridership.
My story was validated by the RTD; according to the final RTD report, RTD did indeed see 22% increased ridership during the free-fare month, up 36% from the August prior. This increase led some to conclude that the campaign was a huge success, and also to the expansion of the program in 2023.
But wait… the campaign is called “Zero fare for better air”. So for this to really be a success, the policy change should be measurable in better air quality, not just ridership. To this point, the report concluded that “impacts to air quality are difficult to quantify”. They mention this difficulty is due to no baseline provided. So we’re left wondering – did it work? Did we actually have cleaner air in August of 2022?
Recently, my team investigated how the Covid-19 pandemic affected congestion and air quality in cities across the US (we found that it did). In this post I use similar outcomes and methods to determine the impact of this policy in Denver.
Air Quality Data
There are plenty of important pollutants to worry about in our air, but automobile traffic contributes especially to nitrous oxide (NO2) and ozone (O3). We’ll consider each of these using data from the EPA’s Air Quality System.
Note
Code and data for this and other blog posts are available here.
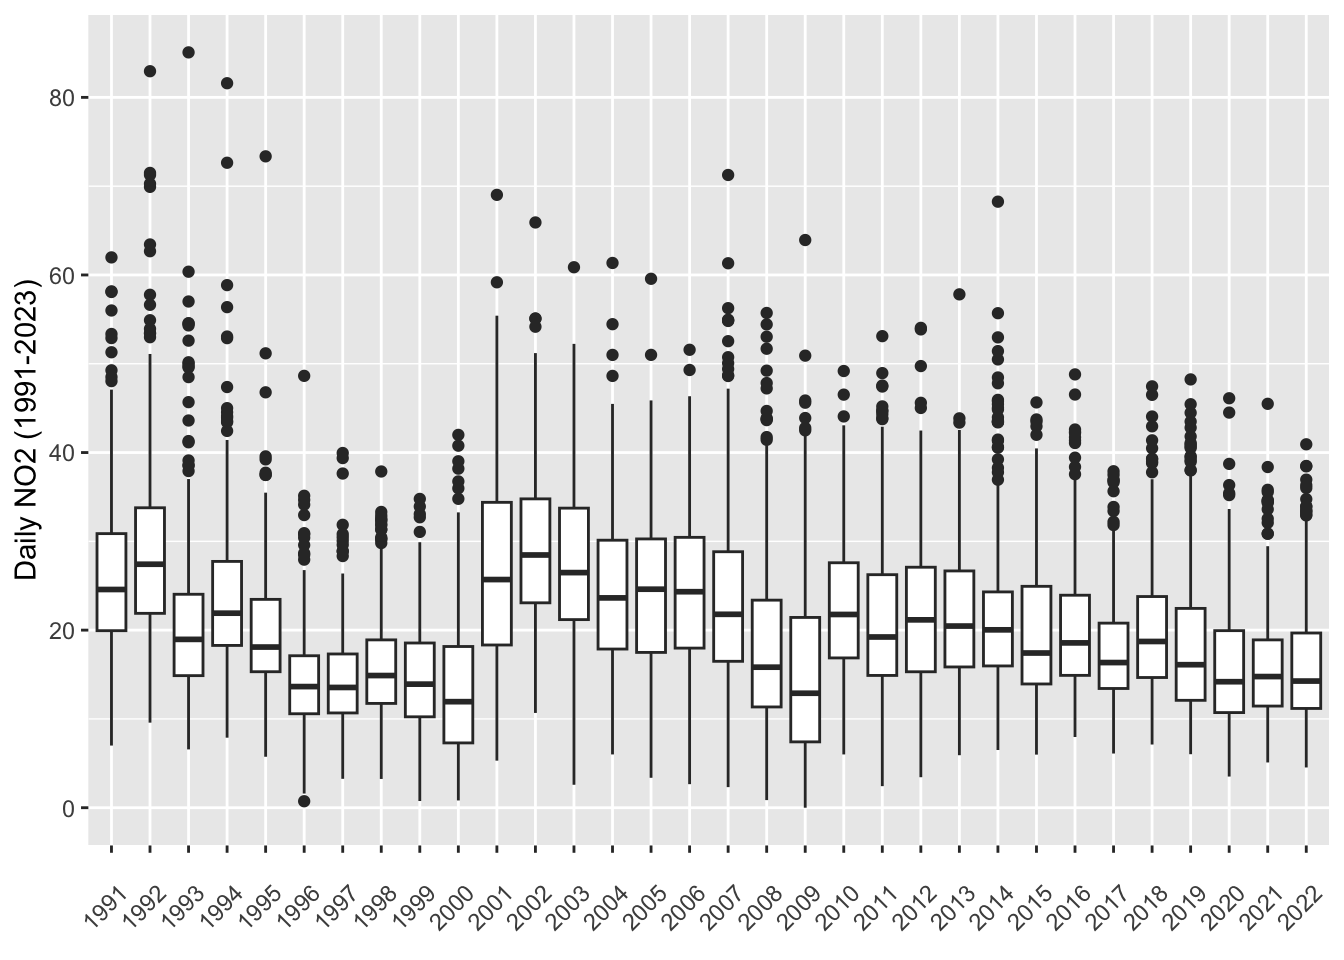
NO2
Data visualizations
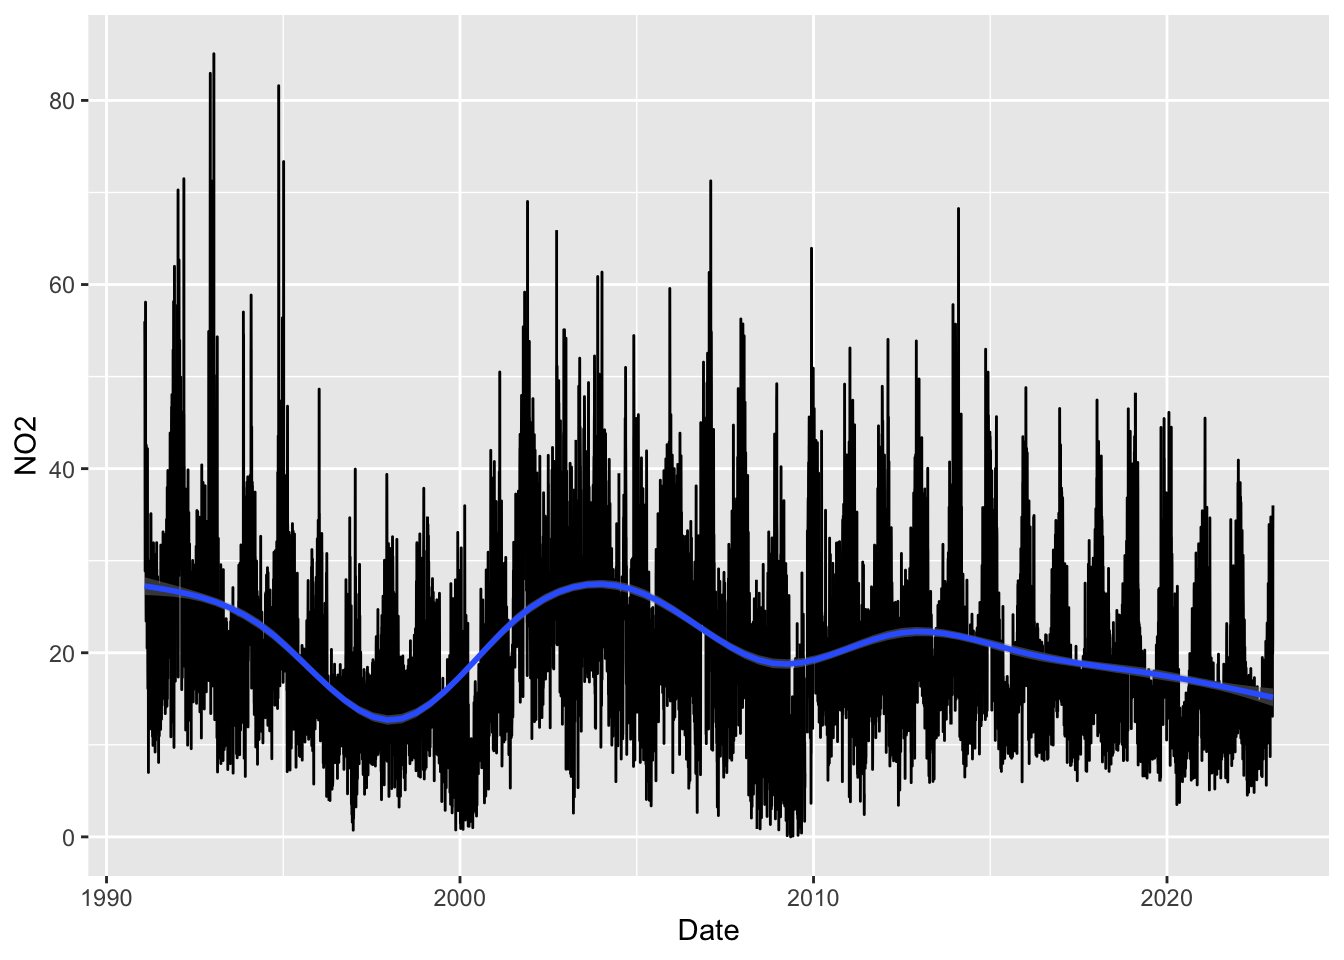
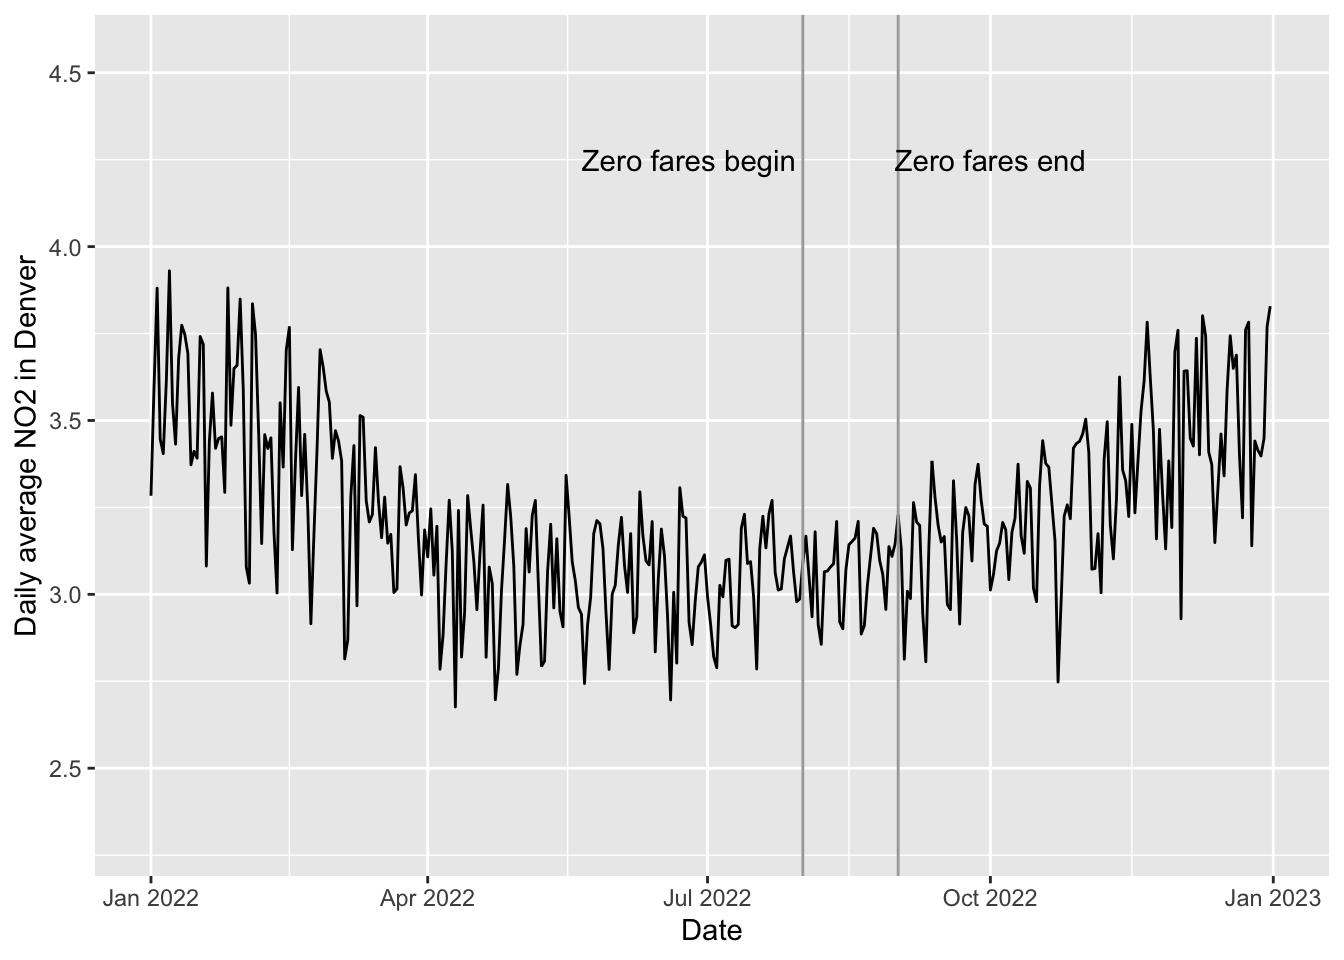
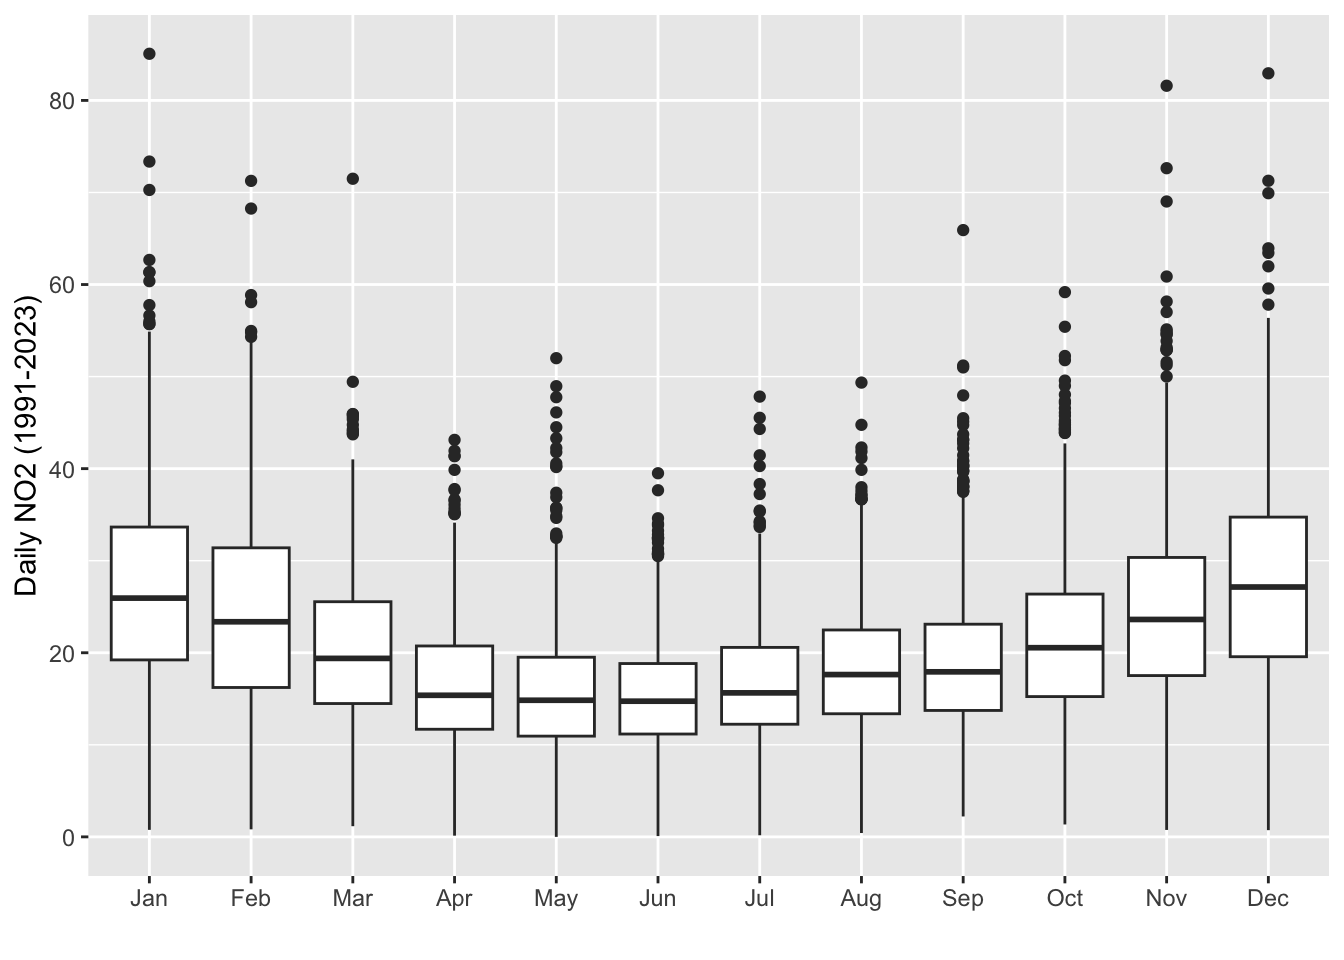
Here are plots of the historical daily data for NO2 in Denver.

Modeling
We can use this historical data to build a forecast of what August’s NO2 levels would be using forecasting methodology available in the fastTS R package that can handle this kind of seasonal data. The series is logged (+10) prior to modeling. We include weekday and month indicator variables and a natural cubic basis spline for time. We computed 30-day-ahead predictions and tested whether these predictions were significantly different than the observed daily values during the zero-fare period. As some months were easier to forecast than others (August was easier to forecast than winter months), we also use heteroskedasticity-corrected standard errors. To evaluate our model, a 10% test set was held out.

Our model can predict daily NO2 on the log scale to within about 0.175 units, with an out-of-sample \(R^2\) of 0.533 (about 53% of the variation in this outcome can be explained by historical patterns in our model).
The observed daily NO2 values were on average a factor of 0.932 lower, or 6.8% lower, during the zero-fare month compared to their forecasted values (95% CI: 0.921, 0.944). This is strong evidence of a decrease in daily NO2 during the month of August 2022 than would have been expected historically.
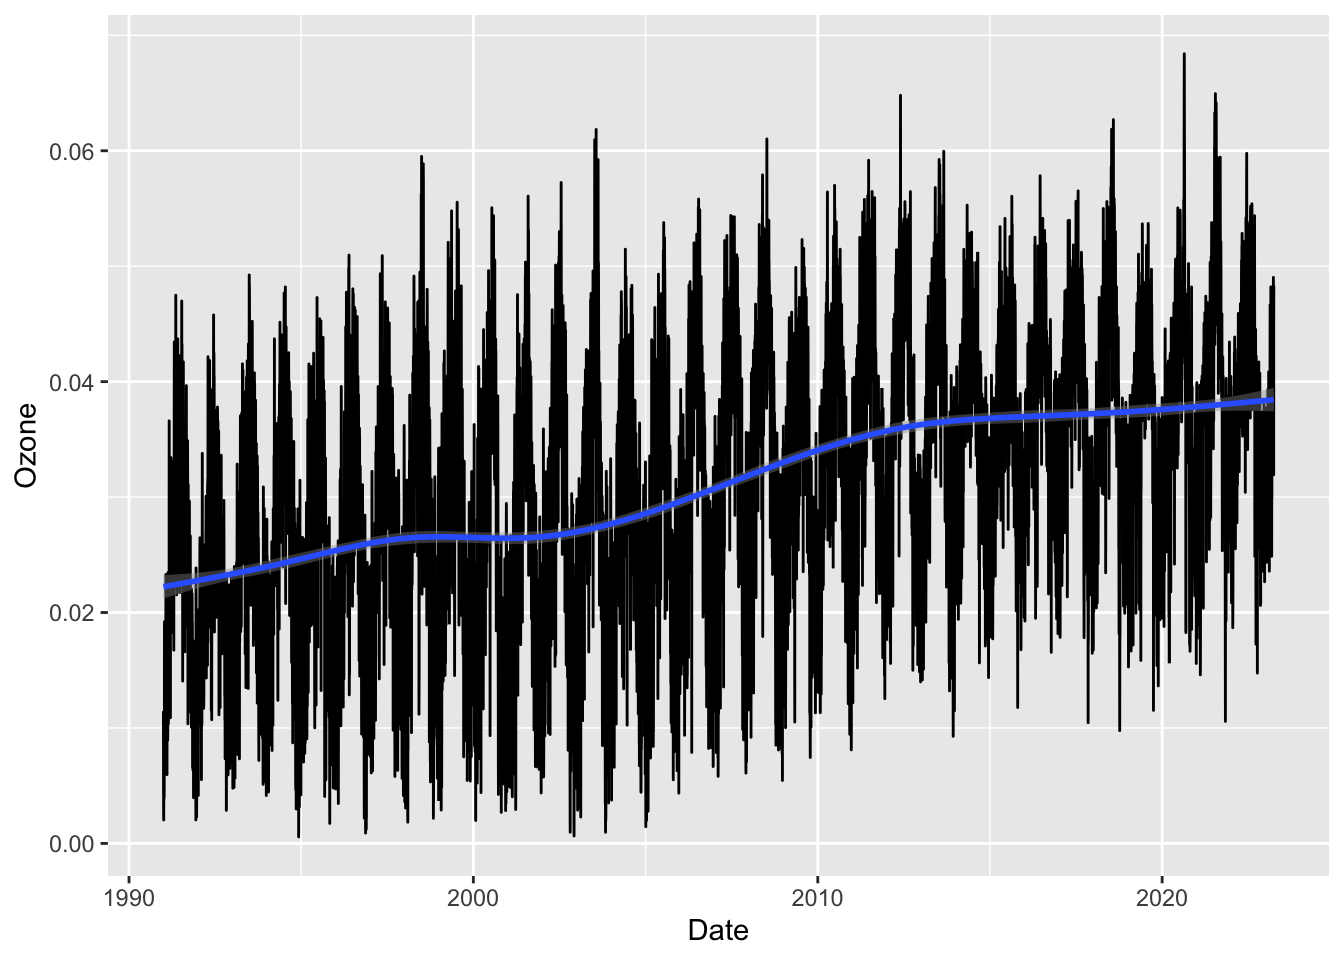
Ozone
Data visualizations
Here are plots of the historical daily data for ozone in Denver.


Modeling
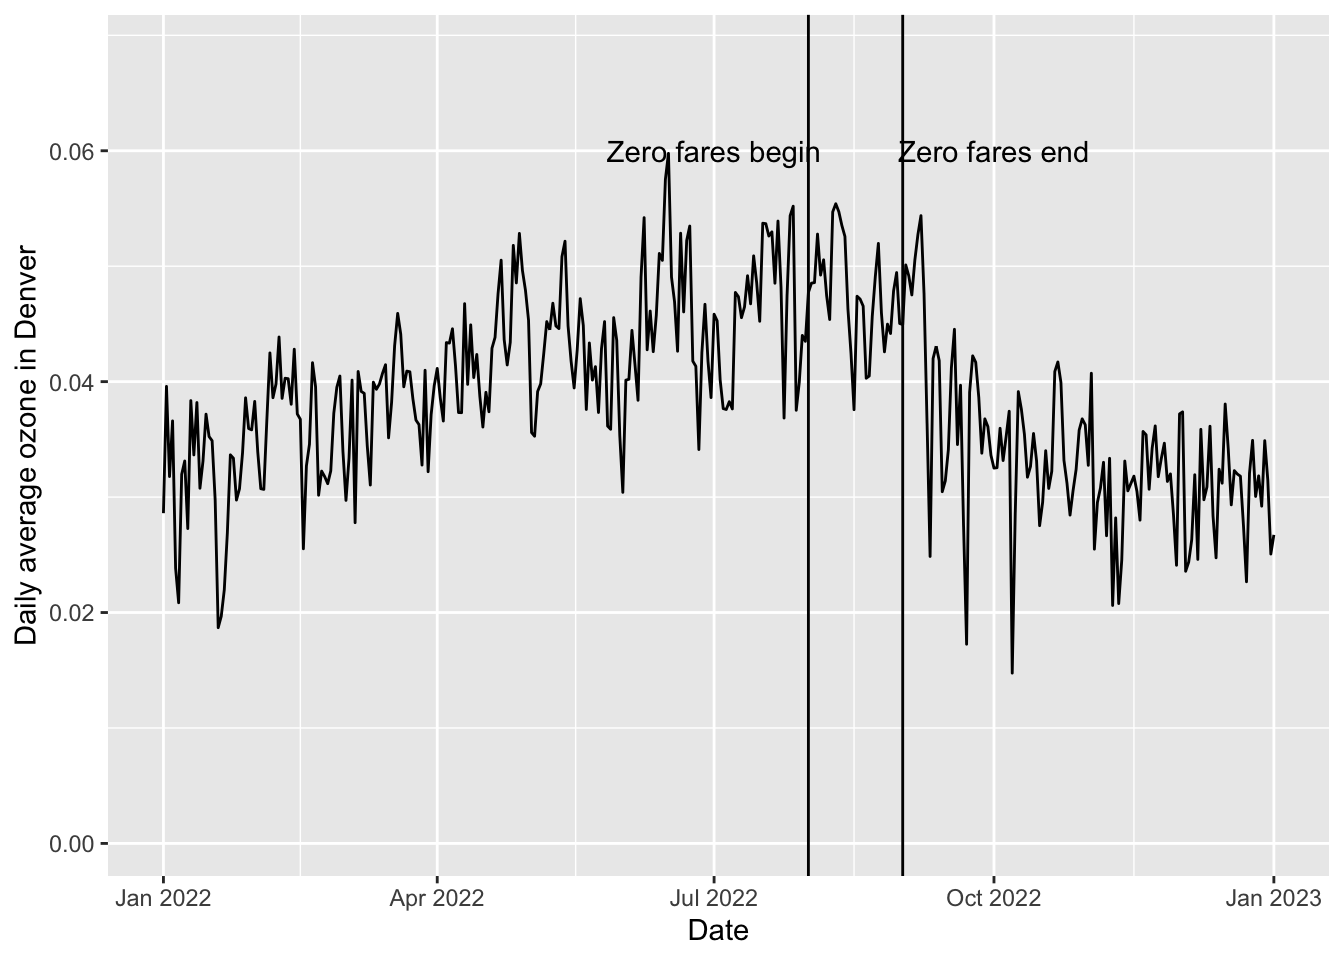
Modeling of ozone data proceeded similarly, although no outcome transformation was used.

Our model can predict daily ozone to within about 0.005 units, with an out-of-sample \(R^2\) of 0.67 (about 67% of the variation in this outcome can be explained by historical patterns in our model).
The observed daily ozone values were on average -0.001 parts per million lower during the zero-fare month compared to their forecasted values (95% CI: -0.002, -0.001). This doesn’t show evidence of a change in daily ozone during the month of August 2022 in comparison to would have been expected historically.
Takeaways
- Daily average NO2 in Denver during the zero fare month was about 7% less than forecasts (p < 0.001)!
- No observable change was seen in ozone relative to forecasts.
- There is room for more to be done to improve Denver’s air quality.
Limitations
Ozone and NO2 are affected by many things on a daily basis, which were not controlled for in this analysis. A more effective analysis would control for these things, which might have improved the precision of the model estimates or better account for the possibility of confounding. Both outcomes are also not perfectly measured by the AQS stations scattered about the city of Denver; there’s always the possibility that more accurate or more granular data could better show an effect of the zero-fare policy.
Sensitivity of method
If the method we used for determining the effect of intervention were flawed, we might expect to see high rejection rates for any other subset of 31 days. We can check this by reproducing the same method for 31-day chunks of time surrounding August 2022. Below is a table of the estimated effect under the same methodology for every cut point listed, including FDR-adjusted (and nominal) p-values as well as effect size estimates.
| cut | estimate | ci_lb | ci_ub | p.value | p.adj |
|---|---|---|---|---|---|
| 2021-01-01 | 1.008 | 0.96 | 1.06 | 0.86 | 0.95 |
| 2021-02-01 | 0.989 | 0.95 | 1.03 | 0.80 | 0.95 |
| 2021-03-01 | 1.082 | 1.04 | 1.13 | 0.054 | 0.21 |
| 2021-04-01 | 0.997 | 0.97 | 1.02 | 0.90 | 0.95 |
| 2021-05-01 | 1.035 | 1.01 | 1.06 | 0.094 | 0.29 |
| 2021-06-01 | 1.030 | 1.01 | 1.05 | 0.17 | 0.37 |
| 2021-07-01 | 0.965 | 0.95 | 0.98 | 0.033 | 0.16 |
| 2021-08-01 | 0.977 | 0.96 | 0.99 | 0.18 | 0.37 |
| 2021-09-01 | 0.999 | 0.97 | 1.03 | 0.99 | 0.99 |
| 2021-10-01 | 1.004 | 0.97 | 1.04 | 0.91 | 0.95 |
| 2021-11-01 | 0.944 | 0.91 | 0.98 | 0.12 | 0.32 |
| 2021-12-01 | 0.977 | 0.94 | 1.02 | 0.58 | 0.89 |
| 2022-01-01 | 1.132 | 1.09 | 1.18 | 0.002 | 0.019 |
| 2022-02-01 | 1.024 | 0.98 | 1.07 | 0.59 | 0.89 |
| 2022-03-01 | 0.958 | 0.93 | 0.99 | 0.15 | 0.36 |
| 2022-04-01 | 0.920 | 0.89 | 0.95 | 0.009 | 0.068 |
| 2022-05-01 | 0.986 | 0.96 | 1.01 | 0.54 | 0.89 |
| 2022-06-01 | 1.019 | 0.99 | 1.04 | 0.44 | 0.81 |
| 2022-07-01 | 0.970 | 0.95 | 0.99 | 0.098 | 0.29 |
| 2022-08-01 | 0.932 | 0.92 | 0.94 | < 0.001 | < 0.001 |
| 2022-09-01 | 0.989 | 0.97 | 1.01 | 0.66 | 0.93 |
| 2022-10-01 | 0.990 | 0.96 | 1.02 | 0.70 | 0.93 |
| 2022-11-01 | 1.008 | 0.97 | 1.05 | 0.85 | 0.95 |
| 2022-12-01 | 1.103 | 1.05 | 1.15 | 0.032 | 0.16 |
On the horizon
Come August 2023, Denver will roll out the program again and I will revisit this analysis to see whether zero fares produce observably cleaner air throughout the month. Please check out their website to sign up and participate.
Note
Again, code and data for this and other posts are available here. This post was updated on 2/15/2024 to point to the fastTS R package, which is an updated version of srlTS, and again on 6/11/2024 based on a bug fix in fastTS 1.0.0, which strengthened the observed effect of NO2.
Appendix
R Session Info
sessioninfo::session_info()─ Session info ───────────────────────────────────────────────────────────────
setting value
version R version 4.5.1 (2025-06-13)
os macOS Sequoia 15.7.1
system aarch64, darwin20
ui X11
language (EN)
collate en_US.UTF-8
ctype en_US.UTF-8
tz America/Chicago
date 2025-11-20
pandoc 3.6.3 @ /Applications/RStudio.app/Contents/Resources/app/quarto/bin/tools/aarch64/ (via rmarkdown)
quarto 1.7.32 @ /Applications/RStudio.app/Contents/Resources/app/quarto/bin/quarto
─ Packages ───────────────────────────────────────────────────────────────────
package * version date (UTC) lib source
bit 4.6.0 2025-03-06 [1] CRAN (R 4.5.0)
bit64 4.6.0-1 2025-01-16 [1] CRAN (R 4.5.0)
cli 3.6.5 2025-04-23 [1] CRAN (R 4.5.0)
crayon 1.5.3 2024-06-20 [1] CRAN (R 4.5.0)
digest 0.6.37 2024-08-19 [1] CRAN (R 4.5.0)
dplyr * 1.1.4 2023-11-17 [1] CRAN (R 4.5.0)
evaluate 1.0.5 2025-08-27 [1] CRAN (R 4.5.0)
farver 2.1.2 2024-05-13 [1] CRAN (R 4.5.0)
fastmap 1.2.0 2024-05-15 [1] CRAN (R 4.5.0)
forcats * 1.0.1 2025-09-25 [1] CRAN (R 4.5.0)
generics 0.1.4 2025-05-09 [1] CRAN (R 4.5.0)
ggplot2 * 4.0.0 2025-09-11 [1] CRAN (R 4.5.0)
glue 1.8.0 2024-09-30 [1] CRAN (R 4.5.0)
gtable 0.3.6 2024-10-25 [1] CRAN (R 4.5.0)
here 1.0.2 2025-09-15 [1] CRAN (R 4.5.0)
hms 1.1.4 2025-10-17 [1] CRAN (R 4.5.0)
htmltools 0.5.8.1 2024-04-04 [1] CRAN (R 4.5.0)
htmlwidgets 1.6.4 2023-12-06 [1] CRAN (R 4.5.0)
jsonlite 2.0.0 2025-03-27 [1] CRAN (R 4.5.0)
knitr 1.50 2025-03-16 [1] CRAN (R 4.5.0)
lifecycle 1.0.4 2023-11-07 [1] CRAN (R 4.5.0)
lubridate * 1.9.4 2024-12-08 [1] CRAN (R 4.5.0)
magrittr 2.0.4 2025-09-12 [1] CRAN (R 4.5.0)
pillar 1.11.1 2025-09-17 [1] CRAN (R 4.5.0)
pkgconfig 2.0.3 2019-09-22 [1] CRAN (R 4.5.0)
png * 0.1-8 2022-11-29 [1] CRAN (R 4.5.0)
prettyunits 1.2.0 2023-09-24 [1] CRAN (R 4.5.0)
progress * 1.2.3 2023-12-06 [1] CRAN (R 4.5.0)
purrr * 1.2.0 2025-11-04 [1] CRAN (R 4.5.0)
R6 2.6.1 2025-02-15 [1] CRAN (R 4.5.0)
RColorBrewer 1.1-3 2022-04-03 [1] CRAN (R 4.5.0)
readr * 2.1.5 2024-01-10 [1] CRAN (R 4.5.0)
rlang 1.1.6 2025-04-11 [1] CRAN (R 4.5.0)
rmarkdown 2.30 2025-09-28 [1] CRAN (R 4.5.0)
rprojroot 2.1.1 2025-08-26 [1] CRAN (R 4.5.0)
rstudioapi 0.17.1 2024-10-22 [1] CRAN (R 4.5.0)
S7 0.2.0 2024-11-07 [1] CRAN (R 4.5.0)
scales 1.4.0 2025-04-24 [1] CRAN (R 4.5.0)
sessioninfo 1.2.3 2025-02-05 [1] CRAN (R 4.5.0)
stringi 1.8.7 2025-03-27 [1] CRAN (R 4.5.0)
stringr * 1.6.0 2025-11-04 [1] CRAN (R 4.5.0)
tibble * 3.3.0 2025-06-08 [1] CRAN (R 4.5.0)
tidyr * 1.3.1 2024-01-24 [1] CRAN (R 4.5.0)
tidyselect 1.2.1 2024-03-11 [1] CRAN (R 4.5.0)
tidyverse * 2.0.0 2023-02-22 [1] CRAN (R 4.5.0)
timechange 0.3.0 2024-01-18 [1] CRAN (R 4.5.0)
tzdb 0.5.0 2025-03-15 [1] CRAN (R 4.5.0)
vctrs 0.6.5 2023-12-01 [1] CRAN (R 4.5.0)
vroom 1.6.6 2025-09-19 [1] CRAN (R 4.5.0)
withr 3.0.2 2024-10-28 [1] CRAN (R 4.5.0)
xfun 0.54 2025-10-30 [1] CRAN (R 4.5.0)
yaml 2.3.10 2024-07-26 [1] CRAN (R 4.5.0)
[1] /Users/rpterson/Library/R/arm64/4.5/library
[2] /Library/Frameworks/R.framework/Versions/4.5-arm64/Resources/library
* ── Packages attached to the search path.
──────────────────────────────────────────────────────────────────────────────Citation
For attribution, please cite this work as:
Peterson, Ryan. 2023. “Did Denver’s 2022 ‘Zero Fare for
Cleaner Air’ Campaign Actually Work?” Data
Diction (blog). July 21, 2023. https://doi.org/10.59350/sktbs-b7v46.
